Power BI really shines when you give it relational data to work with - tables, relationships and enough history to spot a trend. Unfortunately, querying the Parsley API directly from Power BI is slow, fragile and quickly runs into rate limits. The better approach is to stage your Parsley data in a database first, then let Power BI do what it does best: interactive dashboards, drill-downs and combining Parsley with the other systems your business runs on.
In this article, I’ll take you through the steps to connect Power BI to your Parsley data, and get started customizing the reports you need.
Connect to Parsley
If you don’t already have a SyncHub account, you can grab a free trial here - go on, I’ll wait - it only takes a minute and you can cancel as soon as you’ve finished this tutorial if you like.
Ready? Now, a quick reminder - SyncHub works by staging your Parsley data in a relational database. This gives us a huge advantage over other connectors which query the Parsley API directly, but I won’t go in to them here. The point is, once you have connected your Parsley account, querying from Power BI is trivial as you are just using its native SQL Server Connector.
Once connected, you'll find data from all these endpoints streaming down from Parsley, such as this example from the Sale table:
| Name | Time | ID |
|---|---|---|
| Spring Festival Sale | 2024-03-01 10:00:00 | 101 |
| Weekend Special Discount | 2024-03-02 15:30:00 | 132 |
| Holiday Clearance Event | 2024-03-03 18:45:00 | 198 |
After connecting, visit your SyncHub Dashboard and grab your new database credentials - you'll need them below.
Reading your Parsley data from Power BI
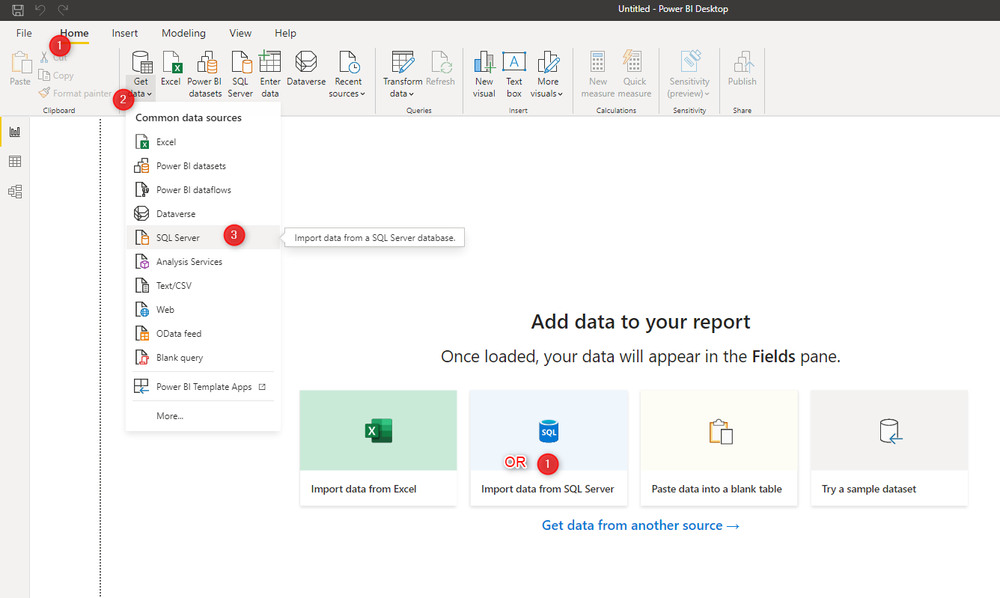
We now just need to tell Power BI where to find your data. Either select Import data from SQL Server or a new SQL Server connection from the Data ribbon:
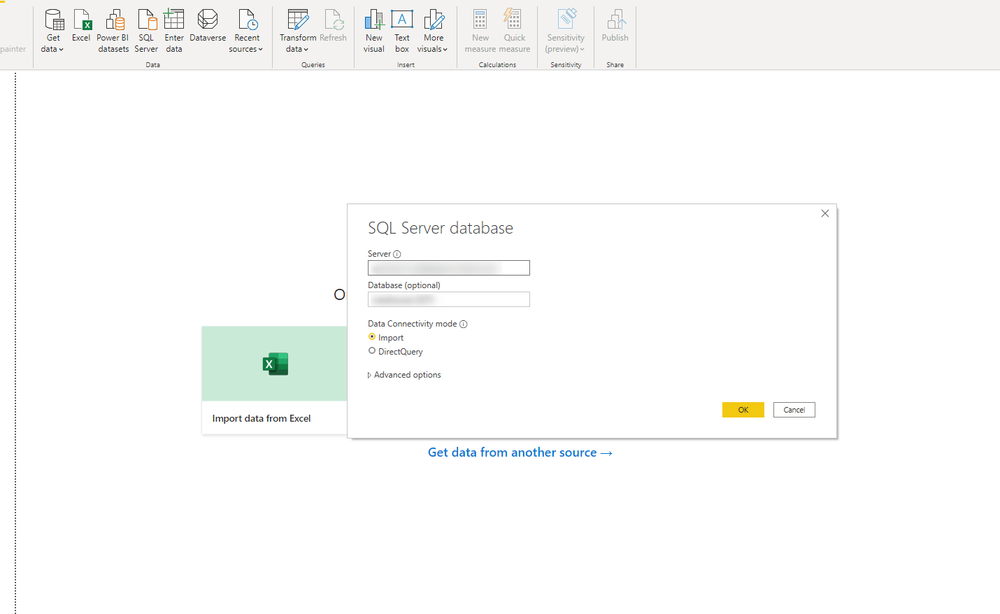
When prompted, enter the Server and Database that SyncHub provided in the first step above:
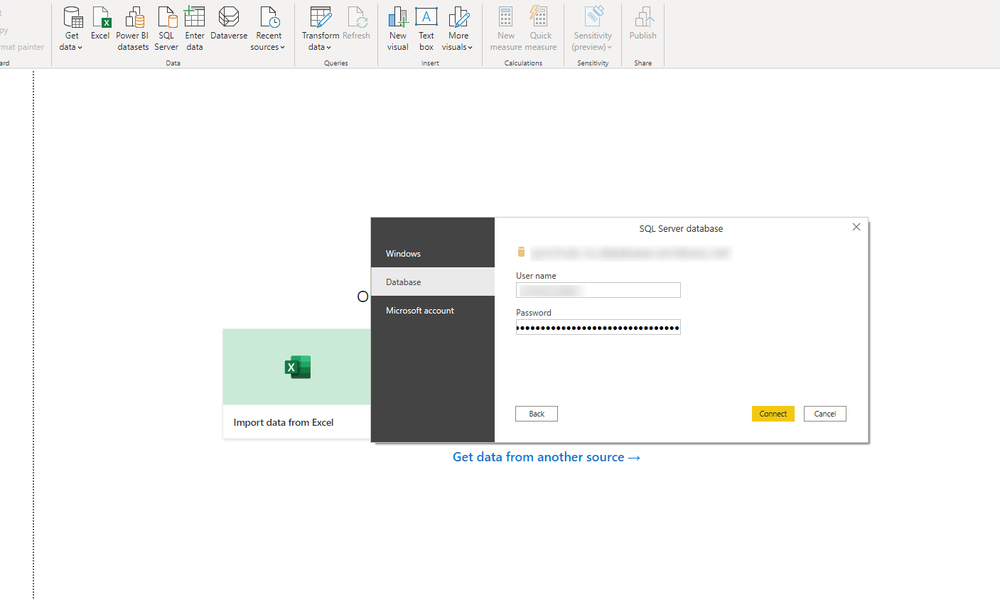
Next - and this is the part that trips most people up - switch to the Database credentials tab (highlighted by the arrow below), then enter the username and password provided to you by SyncHub in the step above:
Troubleshooting
This is the point where you are most likely to run into issues - your login won’t be accepted. After triple-checking that you have used the correct server/database/username/password, the most common resolutions we see are:
- try opening Power BI in Administrator mode
- if you are in an office, perhaps you have some firewall restrictions?
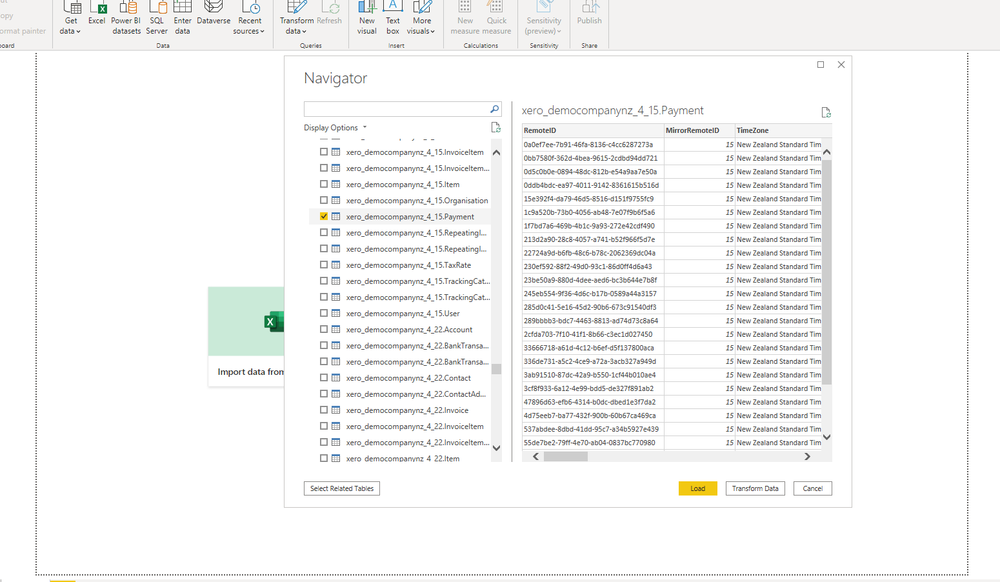
All going well, you’ll now be presented with the tables from Parsley, and you know what to do from here:
Keeping your data up-to-date
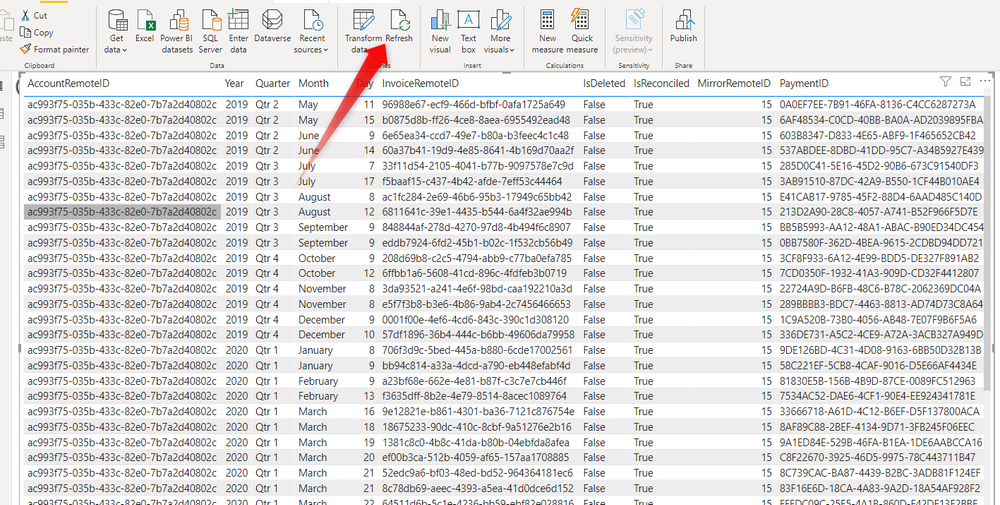
SyncHub updates it’s staged data from Parsley in near-realtime, so it’s always available. However, depending on your Power BI settings you may still observe a delay with your reports. But not to worry - the solution isn’t too onerous. Every time you want to refresh your data, simply click the (appropriately named) Refresh button in your Ribbon:
Beyond Parsley
Parsley-specific reports are essential, but the true power of SyncHub comes when you augment your Parsley data with additional information:
- SyncHub allows you to pull in data from multiple Parsley accounts, and compare/report/aggregate from within the same report. See this blog article for details on aggregating your Parsley data.
- Most businesses use multiple cloud platforms. SyncHub provides connectors to a wide range of popular cloud platforms. Imagine the insights you could gather by consolidating this information into a single dashboard (or see this case study for real-world examples).
So what are you waiting for? Grab a free trial of SyncHub here and see what you can do. In ten minutes from now, you could be reporting against your Parsley data and taking your first steps towards a data-driven business.