Welcome back once again to another exciting edition of AI Corner! Last month we talked about some best practices for using AI to create the data you want to report on. This turned out to be a very popular topic so today I am going to follow up with a brief guide on turning that data into a final report.
The basic idea is to use an Insight or saved Query to structure a predictable report result, and then our Universal MCP Connector to access it via your AI chat (e.g. Claude or ChatGPT).
Create an MCP connection from your AI chatbot
MCP is a protocol that allows AI systems to talk to other software, and we've built a Universal MCP Connector which lets you connect to your SYNCHUB data. Go ahead and connect your AI now - it only takes a minute.
Build your dashboard
The easiest way to get started with dashboards in Claude is to use their artifacts feature, as this is set up for building reusable dashboards and also allows them to be shared with other people. Create a new artifact and walk Claude through what you want to create - what information you want presented, how the user can interact with it and how it should appear.
Make sure to tell Claude that the dashboard will be powered by data pulled from an MCP tool as this will inform its design decisions under the hood. You can ask it to make up dummy data or provide manual examples to use as placeholders.
Get your data ready in SYNCHUB
Here, I've used our Query Editor to build and save a SQL query that pulls metrics from our sales platform. The boss made me obfuscate some figures, but you get the idea...
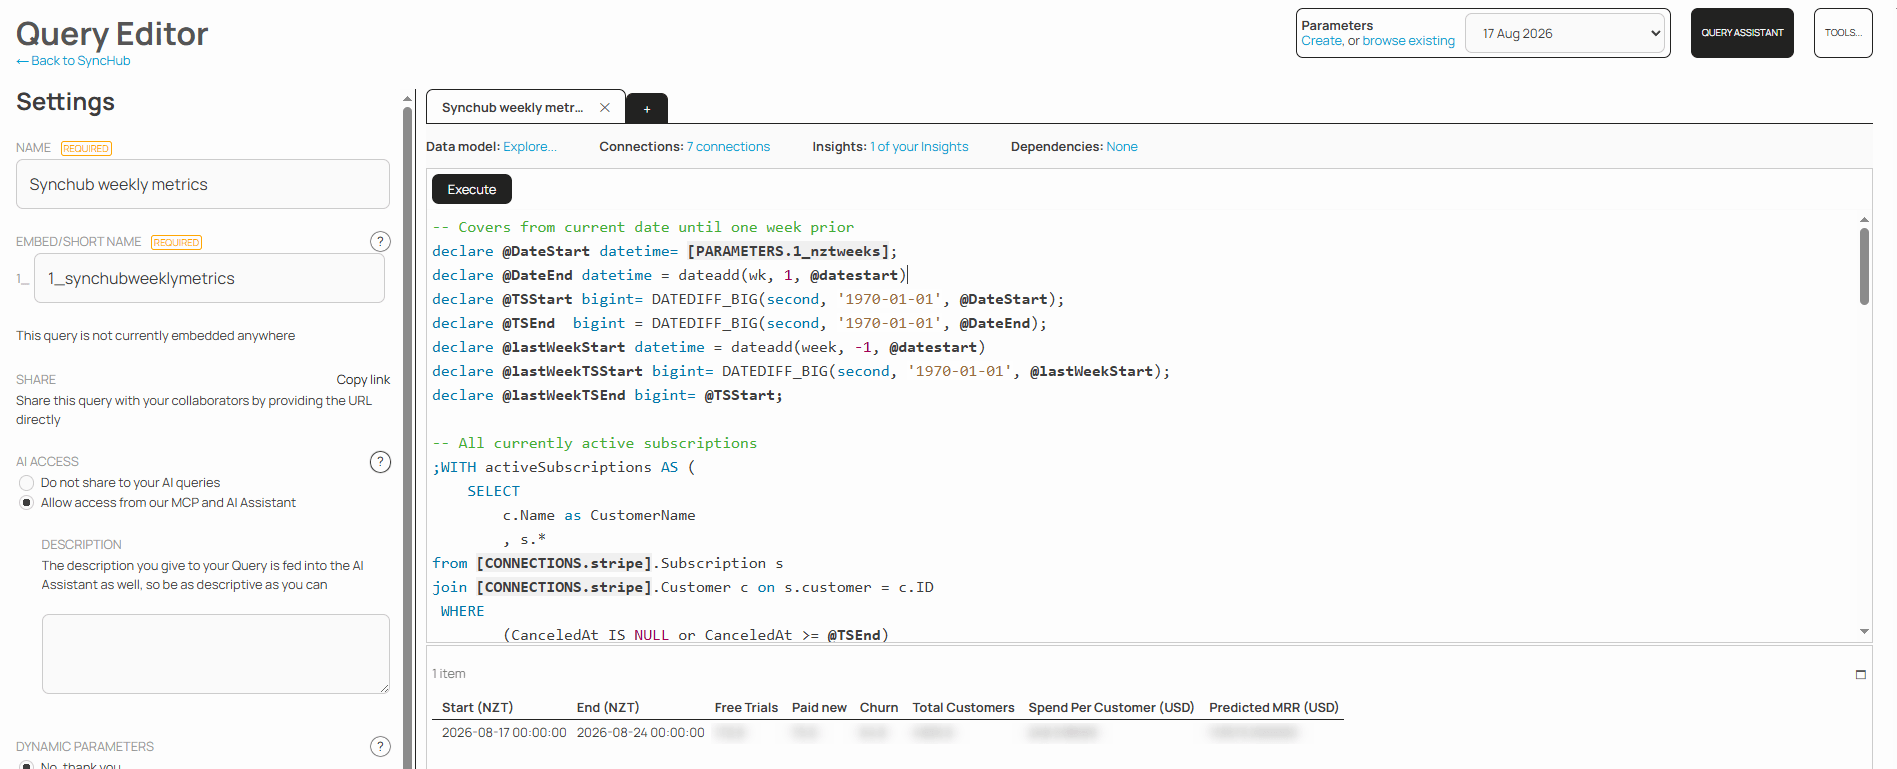
If your query is complex or long-running, you can also convert it into an Insight, which instructs SYNCHUB to pre-populate and stage your data on a schedule. But for now, we'll continue the demonstration by having your dashboard directly execute this SQL query.
Retrieve your data and populate your report
This is the easiest and most magical step. From within the chat where you have built your dashboard, simply request that the AI retrieve the data from your the new Queries (or Insights) you've just created and use the results to populate your dashboard. And voila! your dashboard lives:
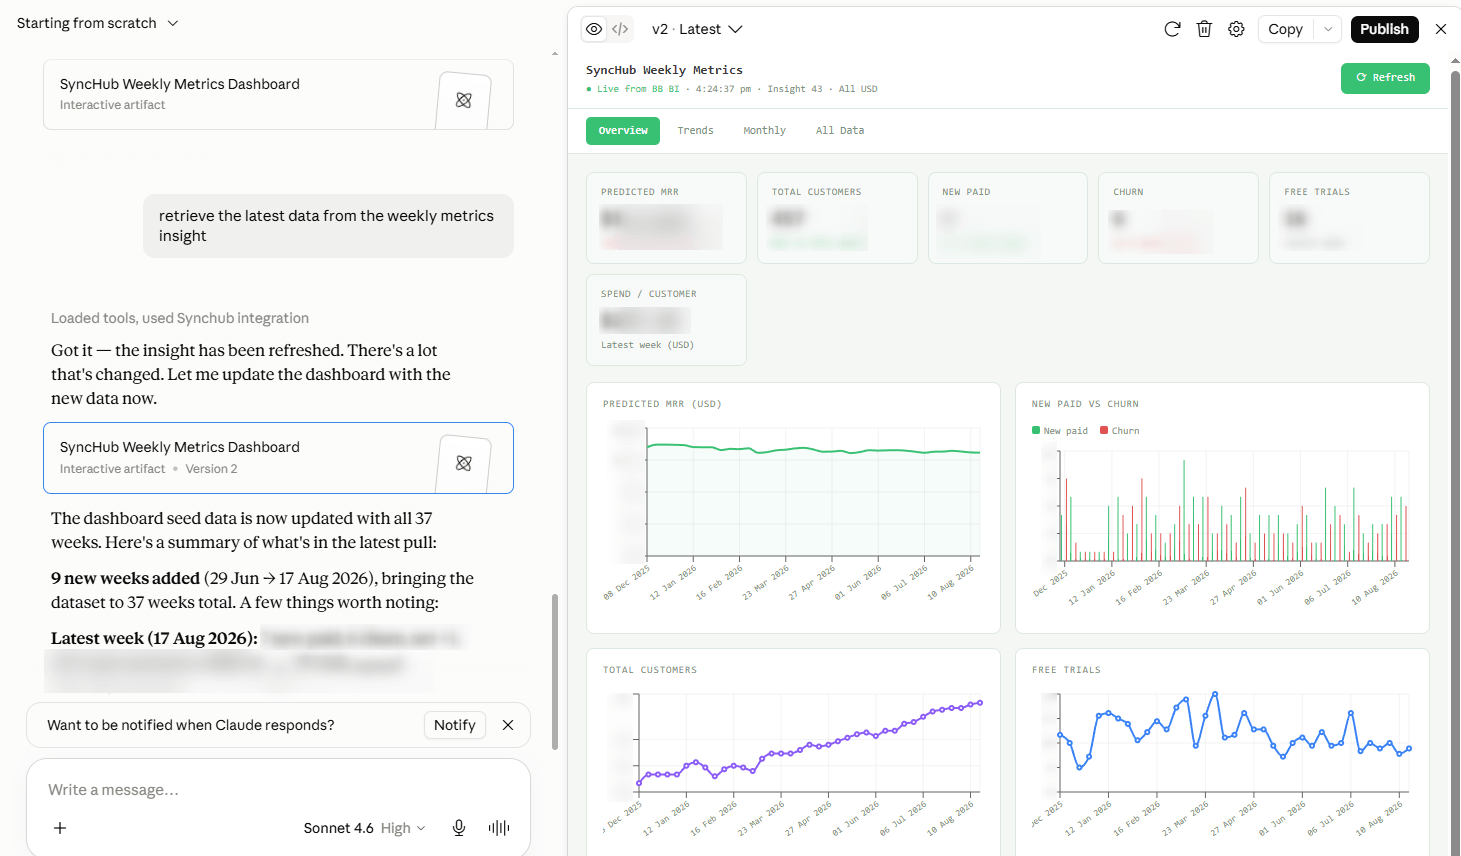
And that's it!
Your dashboard will be filled with the data from SYNCHUB and can be refreshed by yourself or anybody on your team, just by asking your AI to do so. Good luck and happy reporting.